Create a report
It is possible to take the results of a quiz and turn them into a statistical report. This manual will discuss how to create such a report and then how to view it. Making a report is a helpful way to analyze quiz data based on the statistics of the questions and students’ scores. It can also allow you to share anonymous quiz data with other Brightspace users.
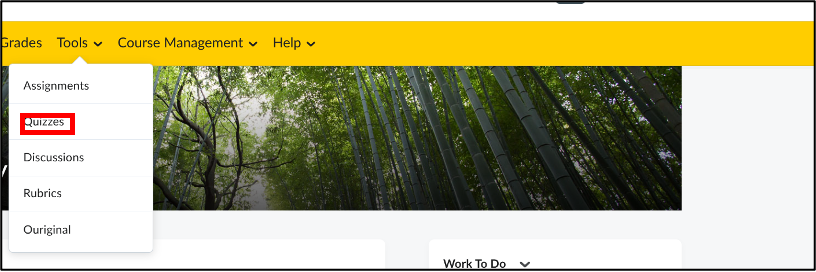
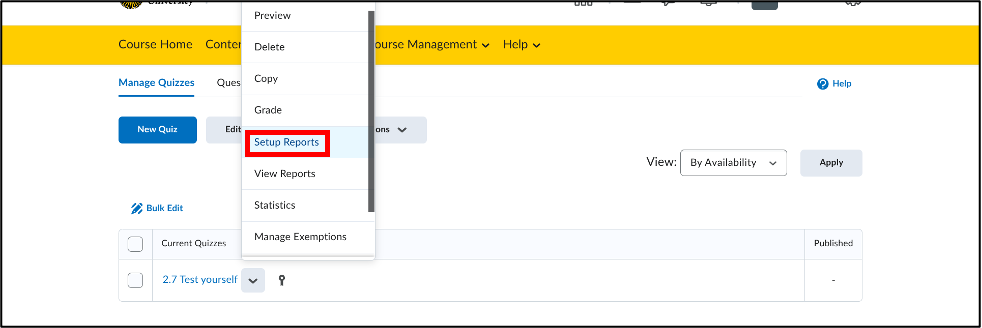
Create a report After selecting a course, navigate to ‘Tools’ in the navbar. Click ‘Quizzes’ and you will see the quizzes homepage. Click the gray arrow next to the quiz you want to report and choose ‘Setup Reports’ from the selection menu. Once you reach this page, follow the instructions below.
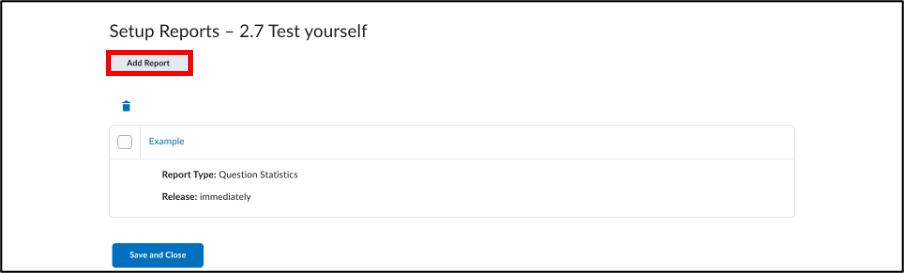
- Select ‘Add Report’.
- Input a Report Name and tick the boxes of the information you want included in the report. For more information on what each choice means, click the grey question mark next to the option.
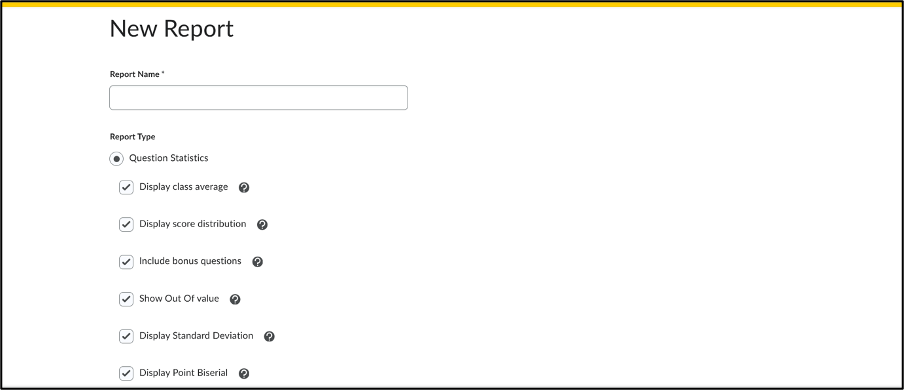
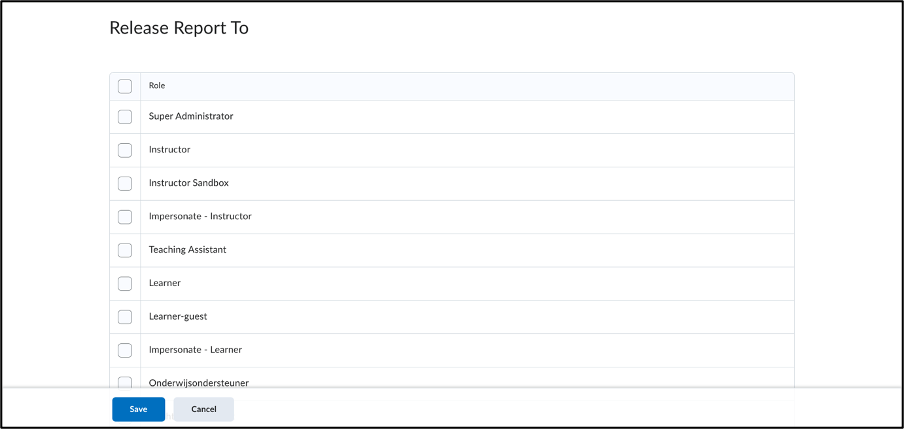
- You can choose to release the report immediately or select a specific date. Under Release Report To, you can select what Brightspace roles have access to the report.
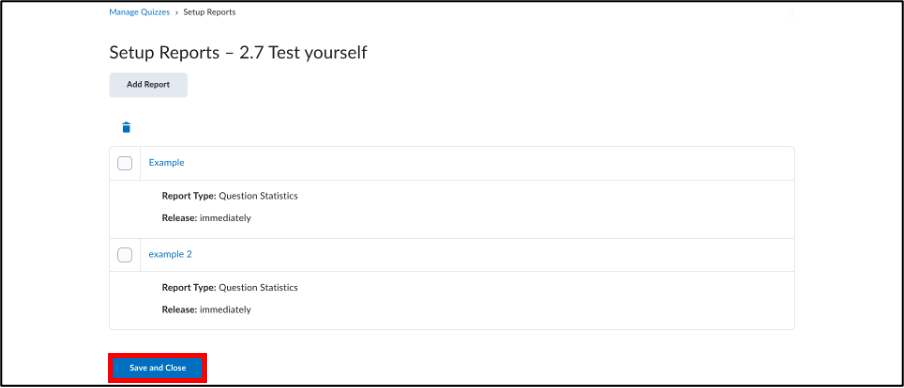
- Click ‘Save’ to return to the Setup Reports tab and to see an overview of all reports created for this quiz.
- Then click ‘Save and Close’.
View a report
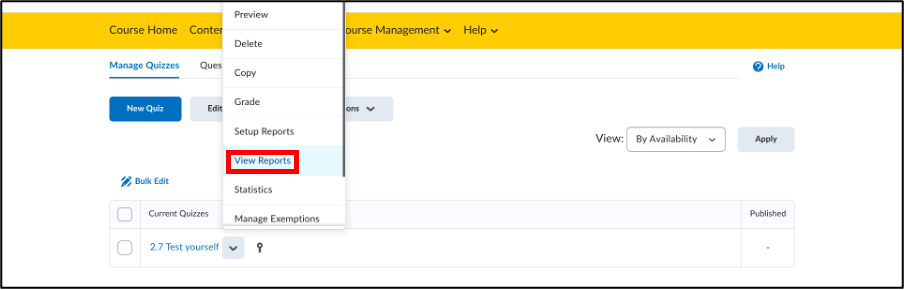
- Once back on the quiz homepage, select the same quiz and click the arrow next to it.
- In the dropdown menu, click ‘View Reports’.
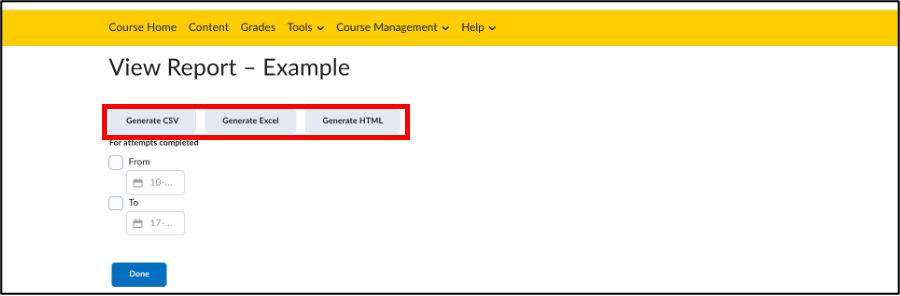
- Click the title of the report you would like to view. You can choose to fill in a time frame that the report will be based on. Under View Report, there are three buttons.
- ‘Generate CSV’: generate the report as a CSV file
- ‘Generate Excel’: generate the report as an Excel file
- ‘Generate HTML’: generate the report in your browser
- After selecting, you will get a notification when the file has been exported. You can then download the file and print. Click ‘Done’ when finished.